A Biomechanical Analysis Of Swimmer's Dolphin Kick
 Olympian Ryan Murphy Demoing my System
1. Initial Planning
The first stage of the project was to plan out exactly how I would implement a system for swimming analysis. The system was installed at the Ensworth High School Natatorium, a world class facility that was eager and willing to have the system installed

Thanks to a Partnership with a company called PlaySight and a generous donation, I was able to plan my project using technology paid for through the Playsight instalation. PlaySight provides a service that allows for everything:
"from full HD live streaming in every athletic facility to coaching and analysis tools, real-time video, analytics and much more.”
With the location selected, planning then involved the logistics of running more than 300ft of specialized CAT6 data cable around the pool. The cable was filled with lithium grease to prevent water entry and subsequent damage. From there, I collaborated with both Ensworth’s head swim coach, Christian Bahr, and a member the IT staff, Jason Robinson, both of whom were instrumental to the completion of this stage of the project. Together we discussed the needs of the swimmers and the capabilities of the camera system, and I sketched out some rough mounting ideas. After this process, I worked with Mike Ireland, my Capstone Advisor, to decide what types of data would be most beneficial for my analysis.
2. Mount Design
The next phase of my project involved designing a mounting platform that would be suitable for multiple different cameras, as well as multiple depths and angles. In the aforementioned discussions with Christian Bahr and Jason Robinson, I had skectched out some ideas and outlined the basic needs of the design.
After that meeting, I returned to the pool to take detailed measurements of the pool’s gutter system and surrounding infastructure. With those details I began to finalize my first design.


Based on the measurements I had taken, I realized that there was enough clearance in the gutter of the pool, covered with a heavy duty plastic grating, that I could implement a mechanism to anchor the cameras into the gutter. With that idea in mind, I utilized the modeling features of Autodesk Fusion 360 to create a rough protoype of what I wanted for the anchoring mechanism. It is a very simple, yet effective design, made up of only two moving parts. A spring-loaded peg is inserted through the top of the mount’s L-frame design and into a hole in the plastic gutter gaurd; a quarter turn of the peg will lock the mount to the wall, with a quarter turn in the opposite direction quickly releasing the mount.
3. Mount Construction
For the first prototype of my mounts, I decided to build the structure from PVC, allowing for rapid prototyping. The mount is designed to be adjustable via two hitch pins that supoort an inner telescoping pipe upon which the camera is attached. The angle and lengh of each segment allows for it to function as a side view or a 45 degree angle from the bottom of the pool. These are the two most helpful positions to analyze and coach from.


As seen in the photos above, the prototype features a rigid structure capable of firmly supporting camera systems in excess of 10 pounds both in and outside of the water, while the hitch pins allow for easy on-deck adjust of camera depth. The prototypes were also painted black for aethetic reasons.
This mount was built to fit the Ensworth pool, but the design can be easily adapted for other pool designs. The bottom of the mounts are left open allowing water to fill and drain from the mount as it enters the pool. This results in greater stability and resistance to waves. Additionally, the open bottom of the PVC allows for quick attachment of mouting solutions for alternate cameras. One such solution is seen on the left of the far right photo. A small adaptor allows for an alternate camera to be mounted with addional possible angles. This is achieved through a rotating arm, allowing for tilt control.
4. First Tests
After the mounts had been completed, getting the cameras mounted, and figuring out the logistics of video capture took a little over two weeks, but the project was begining to come together. Early testing of the camera system in the pool was sucessful and the inegration with Playisght allowed for easy sharing of the footage to everyone on the team, so it could begin to be used as a coaching tool.


With the cameras working as intended, I next turned to how I would analyse the footage captured. To determine how easily swimmers could be tracked from the footage I gathered, I tried out several different tracking suites. I first attempted to track the footage using Adobe After Effects, which though generally used for compositing and 3D animation, does have a soid motion tracking suite built in, and I was already familiar with the program. Seen below is the first test using After Effects, tracking only the hips and feet of the athelte. As is visible in this test, while it can acheive a semi-regular track, it varies significantly and would not be statistically valid. One potential reason for this lack of accuracy and prescision is that the dark background of the water does not provide suffcient contrast against the swimmer. To remedy this I sought to use reflective markers on each joint to allow for better tracking in future tests.
In addition to Adobe After Effects, several other programs were evaluated for use in my project. These included Noldus Ethovision XT, Pasco Capstone, and WinAnalyze. However, in the end, none of these options were suitable for my project. WinAnalyze was an exellent option on paper, but due to it’s $6,000 price tag I was forced to find another option. Ethovision XT was originally designed to track mice and other small animals in laboratory behavioral studies, but I attempted to adapt it to track swimmers. However, I was unable to use Ethovision due to continued problems with the accuracy of the track. While I could have spent months working on finding and perfecting or even designing my own software, I had to begin work on my analysis, so I opted for a manual tracking approach, going frame by frame placing tracking markers.
5. First Study
My first full study once the system was up and running revolved around the relationship between fish-kick tempo and swimmer velocity over various age ranges. This is based off of a similar study sponsored by USA Swimming, which studied this relationship in adult olympic swimmers. That study found that a tempo of one kick per .45 seconds results in the optimal speed, while allowing for endurance. I wanted to see how well this translates to younger age groups, or if a faster or slower tempo produces better results in those groups. While finishing the final aspects of the tracking system, I began to recruit participants for my study. This flyer was posted around the swimming pool and I advertised my study in the Ensworth team’s newsletter.

The QR code in the flyer above links to a google form that prescreened candidates based on age, height and weight, as well as their willingness to complete the study. If all fields in the form are answered in a manner consistent with the study’s parameters, then the participants are recorded and sent on for final approval.
My hypothesis for this study was that for younger swimmers, velocity over faster kick periods will not increase at same rate as older more mature swimmers. This is based on the idea that the younger swimmers will not put at much power into each of their kicks as the older swimmers, which will result in their legs flapping around, but no power generation.
While my intention for this study was to work with 5 different age ranges, I was forced to work with only one age group due to low partipant turn out. Seen below is the breakup of my registered test base, however in the end only 30% of the registered participants completed their recordings, all of whom were in the 15+ range.

6. Testing
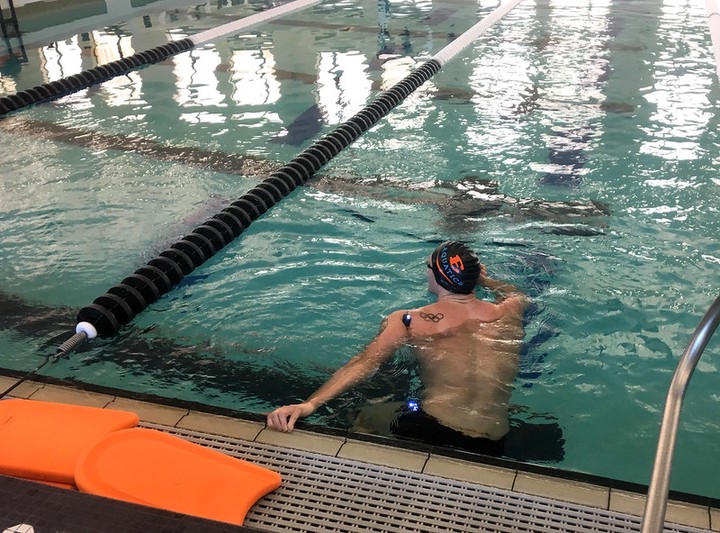
Despite the lack of response from my registed participants, I did have an unexpected tester. My recording process began with Olympic Swimmer and World Record Holder Ryan Murphy, who was kind enough to help out with the study during his visit to the Ensworth Pool. Pictured below,Ryan is wearing my newly designed LED markers, which will allow for more accurate tracking.


I again used Autodesk Fusion 360 to design a series of mounts that allow a waterproof LED component to be fitted onto the swimmer’s joints. The mounts feature a slope adjusted to each limb to fit flush with the skin, being held in place by adjustable elastic bands. Additionally, the thin aqua-dynamic design of the mount decreases the effect on the swimmer’s performance. In fact nearly all the swimmers who tested the design stated it was barely noticiable.


7. Experimental Results:
The study was completed by late March, with about 30% of the originally registered applicants participating. Though there were fewer participants than I would have wanted, I still managed to gather a significant amount of data which has allowed me to make several inferences and find trends.
Result 1.
First, I found that there was an obvious correlation between height and velocity when it comes to underwater kicking. The taller a person is, the faster they will in theory go. This is useful information for a coach, meaning that they can expect more from their taller swimmers, and push them to go faster, while realizing that the shorter swimmers may have less ability.

Result 2.
This graph is somewhat difficult to interpret. The points in orange show the velocity of each swimmer in meters/second as a function of their Target Period. For the study, each swimmer was provided with a tempo trainer device which emits a beep at a defined interval. The swimmer was instructed to match their kick to the beep’s frequency. According to my hypothesis what we should be seeing here with the best fit line is a diagonal line with a decent positive slope. However,As one can see there is an ever so slight positive trend, but not nearly as dramatic of a slope as I have hypothesized. I realized something wasn’t quite right so I decided to do another round of analysis, and determine what the actual period of each swimmer was.
After a painstaking manual analysis of each swimmer’s trial video, I determined that most of the swimmers were not hitting their target periods, and some were off by wide margins. What is shown here in blue is the actual period of each swimmer vs velocity. With the corrected results now in hand, I can conclude that generally as the period decreases, the velocity of the swimmer increases.
But what is more interesting is the cluster of blue points circled in white. These points are all are falling below the average predicted speed for their tempo. This demonstrates a breaking point in the efficiency of the kick for multiple swimmers. After tempos of 0.45 seconds, 100% of the sample group falls below their predicted speeds, which directly correlates to the USA swimming study that found a period of .45 seconds to be the most efficient tempo. This essentially means that when a swimmer is kicking with a tempo faster than 0.45 seconds, they are working harder but not gaining any speed.

Result 3.
This trend can be seen again when examining the percent error vs the target period of each trial. Each swimmer was assigned a specific period, that is “tempo” to hit on each trial. These are what you see across the x-axis.
As the the period was relatively large, the majority of swimmers were hitting above their assigned tempos, thus positive error, but as the period decreased, the error became increasingly negative.
However, even with the small sample size of my trials, the general trend towards significant negative error is accentuated at 0.45 seconds and increases from there.
Now for a coach, this could mean that they know what to expect from their swimmers, and expect most of their swimmers to hit periods up to 0.45 seconds, whereas they would now know that anything faster would be quite challenging.

8. Presentation and Ongoing efforts
These results were summarized and presented to a live audience in May of 2018, the video recording of which is shown below. Though this presentation technically concludes this project academically, I am still pursuing aspects of it during the summer.
A goal for the future is to redesign the camera mounts according to feedback from the coaches at Ensworth. A moving mount for the cameras that would allow the coaches to track along side a swimmer for at least 10 meters is also in planning.
Iain Zwiebel
Biomedical Engineer
Iain Zwiebel is a Biomedical Engineer committed to creating positive change in the world through human centered design, particularly in the health sector.